
20th September 2018, FORCE, Norwegian Petroleum Directorate (NPD), Stavanger
Brief event write up: Dr Paul H Cleverley, Robert Gordon University
Introduction
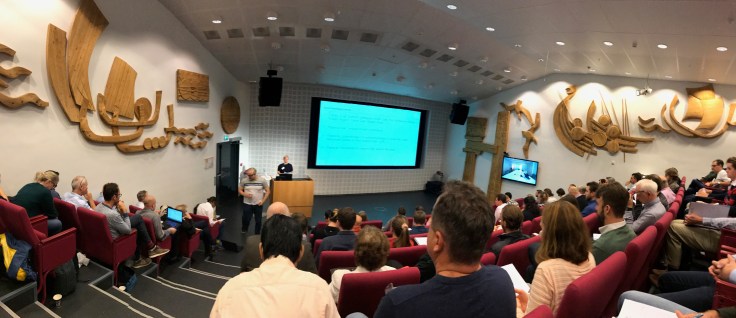
Over 130 people attended the event held in Stavanger on the 20th September, mainly Oil & Gas Operators (Equinor, AkerBP, ConocoPhillips, Spirit Energy, Wintershall etc.). The event was excellently organized by Peter Bormann (ConocoPhillips), Tone Helene Mydland (NPD) and the rest of the organizing committee. With 18 papers and a hackathon I cannot do justice to all that is presented, so this is not an exhaustive report.
Hackathon
During the previous two days a group of around 50 people had participated in Hackathons organized by Agile Scientific (Matt Hall). The NPD and operators had released several geoscience datasets in the Norwegian continental shelf for people to play with. Some great quotes, “People do their best work at play” (as a Python hack myself I agree with that!), “Geologists are label makers”. Matt has helped foster a large community of people with a passion for geoscience programming in the software underground initiative.
The projects undertaken in 2 days are shown below in Figure 1, with people that did not know each other before the event. What was created is quite remarkable. One project extracted textual clues for shows from well reports using trigrams and labelling feeding a NN, even showing the results on a map and by depth!
I spoke to Matt afterwards and the great thing about Hackathon teams is that everyone can contribute, so even if you are not a computer programmer, you can contribute your domain knowledge and general ideas in the team to work with those that can. A great way to build prototypes and of course with Python, so fast to do.

Figure 1 – the projects created inductively during the hackathon
Refresher on Deep Learning
Anders Waldeland (Norske Regnesentral) gave a very useful layperson’s talk on deep learning and why it is different to traditional machine learning. For neural networks, a focus on filter coefficients in layers of convolutions rather than neurons with weights of inputs. With initial layers focusing on low level features and lower layers picking out higher level features. For image analysis (using ImageNet test set of 1.4Million images) over the past few years the scientific community has gone from 75% accuracy towards ‘human like’ 95% accuracy in image classification through these techniques.
Deep learning techniques do require a lot of data (although transfer learning techniques can help) but in general, the more data the better. Some interesting projects involving ‘counting’ were shown, such as counting seals in the arctic and other tasks normally done manually.
Prediction using well logs
Eirik Larsen (Earth Science Analytics) discussed the challenges of predicting properties such as porosity and lithology from log data especially with imperfect data. Traditional methods involve tuning variables per interval and per well. One of the challenges with using human labelled lithology data (e.g. a study for ConocoPhillips using 271 wells in Viking Graben) is that the sets tend to be unbalanced. Some promising results were shown by merging lithology classes and applying data quality control.
Lucy MacGregor (RSI, EPCC, University of Edinburgh) discussed streamlining petrophysical workflows with machine learning. The availability of OpenSource ML libraries and rich rock physical atlases was put forward as reasons why new workflows are becoming possible. A dataset of 2,000 wells (well log data) was used to predict mineralogy. As in the previous example, there was a bias in the training data, lots of quartz and clay, not much of anything else (e.g. coal, calcite). Boosted trees was found to be the best algorithm to date as it can deal better with data gaps than other methods, with optimization of hyper-parameters (as I have found in my own text analytics research) being critical.
Hyperopt was used to find the best hyperparameters using significant compute power and parallelization. Areas for further research included questions such as ‘how good a model do we need so its useful?’ Although the goal is to use raw well log data, at present a lot of data qc is needed.
A novel method was presented by Anders Draege (Equinor) for automated fluid substitution from non-linear regression as an alternative (or QA/QC check) for Gasman’s equation. I won’t go into the details here so you may want to check out the presentation on the FORCE website. The dataset consisted of 6,000 wells drilled on the Norwegian Continental Shelf. Of particular interest was carbonates, where Gasman’s struggles for prediction. Fluid substitution is useful in exploration for modelling target reflectivity, seismic inversion, amplitude v angle and drill or drop decisions. There are numerous applications in reservoir modelling such as monitoring fluid movement.
Jo Eidsvik (NTNU) finished the session with a presentation on sequential Bayesian methods for spatial on-line pore pressure prediction from well log data.
Prediction using seismic
Per Avseth (Dig Science) gave an interesting talk on seismic facies classification away from well control, as exploration activities increase to target stratigraphic traps not structural highs. Using burial history modelling and creating ‘pseudo wells’ to generate an AVO result for a given burial history may improve machine learning in exploration. He discussed the importance of domain knowledge in machine learning, it is not a ‘black box’ geological and geophysical input is needed.
Espen Raknes (AkerBP) gave a presentation on automated seismic interpretation using
machine learning and field interpretations, building on work published by Shell in 2014. Data was used from the Barents Sea/North Sea, where significant amounts of human labelled seismic interpretations exist. Issues for machine learning are that areas can be quite different, geoscience interpretations made by people contain many false negatives but few false positives, so non-symmetric label noise can be an issue. Synthetic data can be used to help training and in general, production areas are likely to give better results than in exploration areas due to volume of training data. An interesting observation was made about out-of-the box neural networks where a standard loss function means that finding straight lines (e.g. faults) can be problematic. Future work proposed including using transfer learning, synthetic (artificial data), a better benchmark test set to see how well an algorithm is working, combine datasets and use of pre-stack seismic.
The final presentation of the session Julie Vonnnet (Emerson) discussed the use of democratic neural networks for predicting rock type distribution away from wells.
Culture and enabling analytics and digitalization
Trygve Karper (Cognite) gave a talk on how ‘data silo’s’ were one of the barriers to undertaking effective data analytics in the organization. In addition, culture, building competencies, supporting universities and working with partners were key.
Per Olav Eide Svendsen (Equinor) gave an insightful talk on their experiences of digitalization. Focusing on the massive cultural element that needs to be addressed. In a recent EAGE event, in an informal survey, he found ‘culture’ was second only to data quality as the barrier people see to effective digitalization and new ways of working using ML techniques in geoscience. Visualization and Analytics were seen as the two main themes. Visualization was identified as key, Equinor have even put some of their code into Github for others to use https://github.com/Statoil/webviz for automatic reporting and visualization.
The use of augmented reality was discussed, so geologists can view interpreted lithology
‘virtually’ appearing next to physical core. So when a geoscientists puts on the VR headset, they see interpreted lithology when they look at the core samples. Having geologists crawl around on the floor in the office is ‘no longer odd’. I thought this was a great use of augmented reality.
A slide was shown that really resonated with me, on ‘who we are, how we work’ at Equinor:
- More chat less meetings
- More stand-up less sit down
- Blurring roles and T-shaped people
- More Python less Excel
- Monthly Python sessions
- Share and collaborate on code
I had to admit I had never heard of ‘T-shaped people’ before, so looked this up. “T-shaped
people have both depth and breadth in their skills. We can contrast a T-shaped person with an I-shaped person. If your skills are I-shaped, you have deep knowledge and experience in one area, but haven’t applied those skills to other areas.”
Questioning team composition more was mentioned. I also liked the modesty of “Where will this take us” – to the reply – “I have no idea but it will be fun trying”. From my perspective this was very refreshing, when in many corporate environments the focus is continually on indicating the Return on Investment (ROI) and value or cost of something, before you have even tried.
I presented on text analytics and some research on using complex word co-occurrence patterns to suggest analogues to geoscientists. Most of the material is on this blog.
Kim Gunn Maver (Iraya Energies) showed an interesting technology pipeline and tool they have built which OCR’s documents, classifies images and presents a search interface to query the text.
The final presentation was from David Wade on cuttings image lithology in interpretation using neural networks. The Cuilin Project, with Equinor’s Digital Centre of Excellence. Typically on a drill rig a photo is taken every 3-10m drilled which can quickly overwhelm human analysis capacity. Deep Learning can help, acknowledging that it can have tendencies to overfit data and needs a lot of data to work effectively.
In a neural network during training, the difference between the networks guess and the actual answer is back-propagated to the network and weights updated. PyTorch was used by the project team classifying to 14 classes: chalk, coal, chalky limestone, shale, sand grains, claystone, halite, silty claystone, siltstone, silty grainstone and micaceous sand.
A GPU is typically 1,000 times faster than a normal laptop. 4 X V100 GPU’s were used which can predict lithology for 4 cuttings a second, a typical well of 500-1000 images can be done in 2-4 mins.
I unfortunately needed to rush to the airport so missed the last few talks, apologies to the authors, I will read their presentation when available:
Machine learning on seismic interpretation (Lukas Mosser, Imperial College London)
Machine learning on 4D seismic (Mike Brhlik, ConocoPhillips)
Quantifying data needs on deep NN for reservoir prop. predictions (Tanya Colwell, CGG)
Machine Learning on SAGD (Chris Olsen, ConocoPhillips)
More information to be found on the FORCE website: www.force.org
Summary
The range of examples shown illustrate how machine learning in the subsurface has moved over the past few years to the next stage; from deep research projects and theory, into practical deployable approaches, API’s and tools applied to real data in a wide variety of settings. The increasing availability of geoscience data in the public domain is likely to facilitate growth in innovation especially perhaps in universities.
Hackathons are increasing in their popularity, both in the industry and within oil & gas companies. Putting people of different skill sets together and making it fun seems to offer
significant benefits. Learning while doing is probably the best way to learn.
Many challenges still exist, such as transferability of machine learning models from one area to another, quality (or even existence) of the training data and changing behaviours for more ‘emergent’ creation of ideas. However…
….its now cool to code again in oil & gas companies 🙂
Paul Cleverley p.h.cleverley@rgu.ac.uk

Leave a comment