
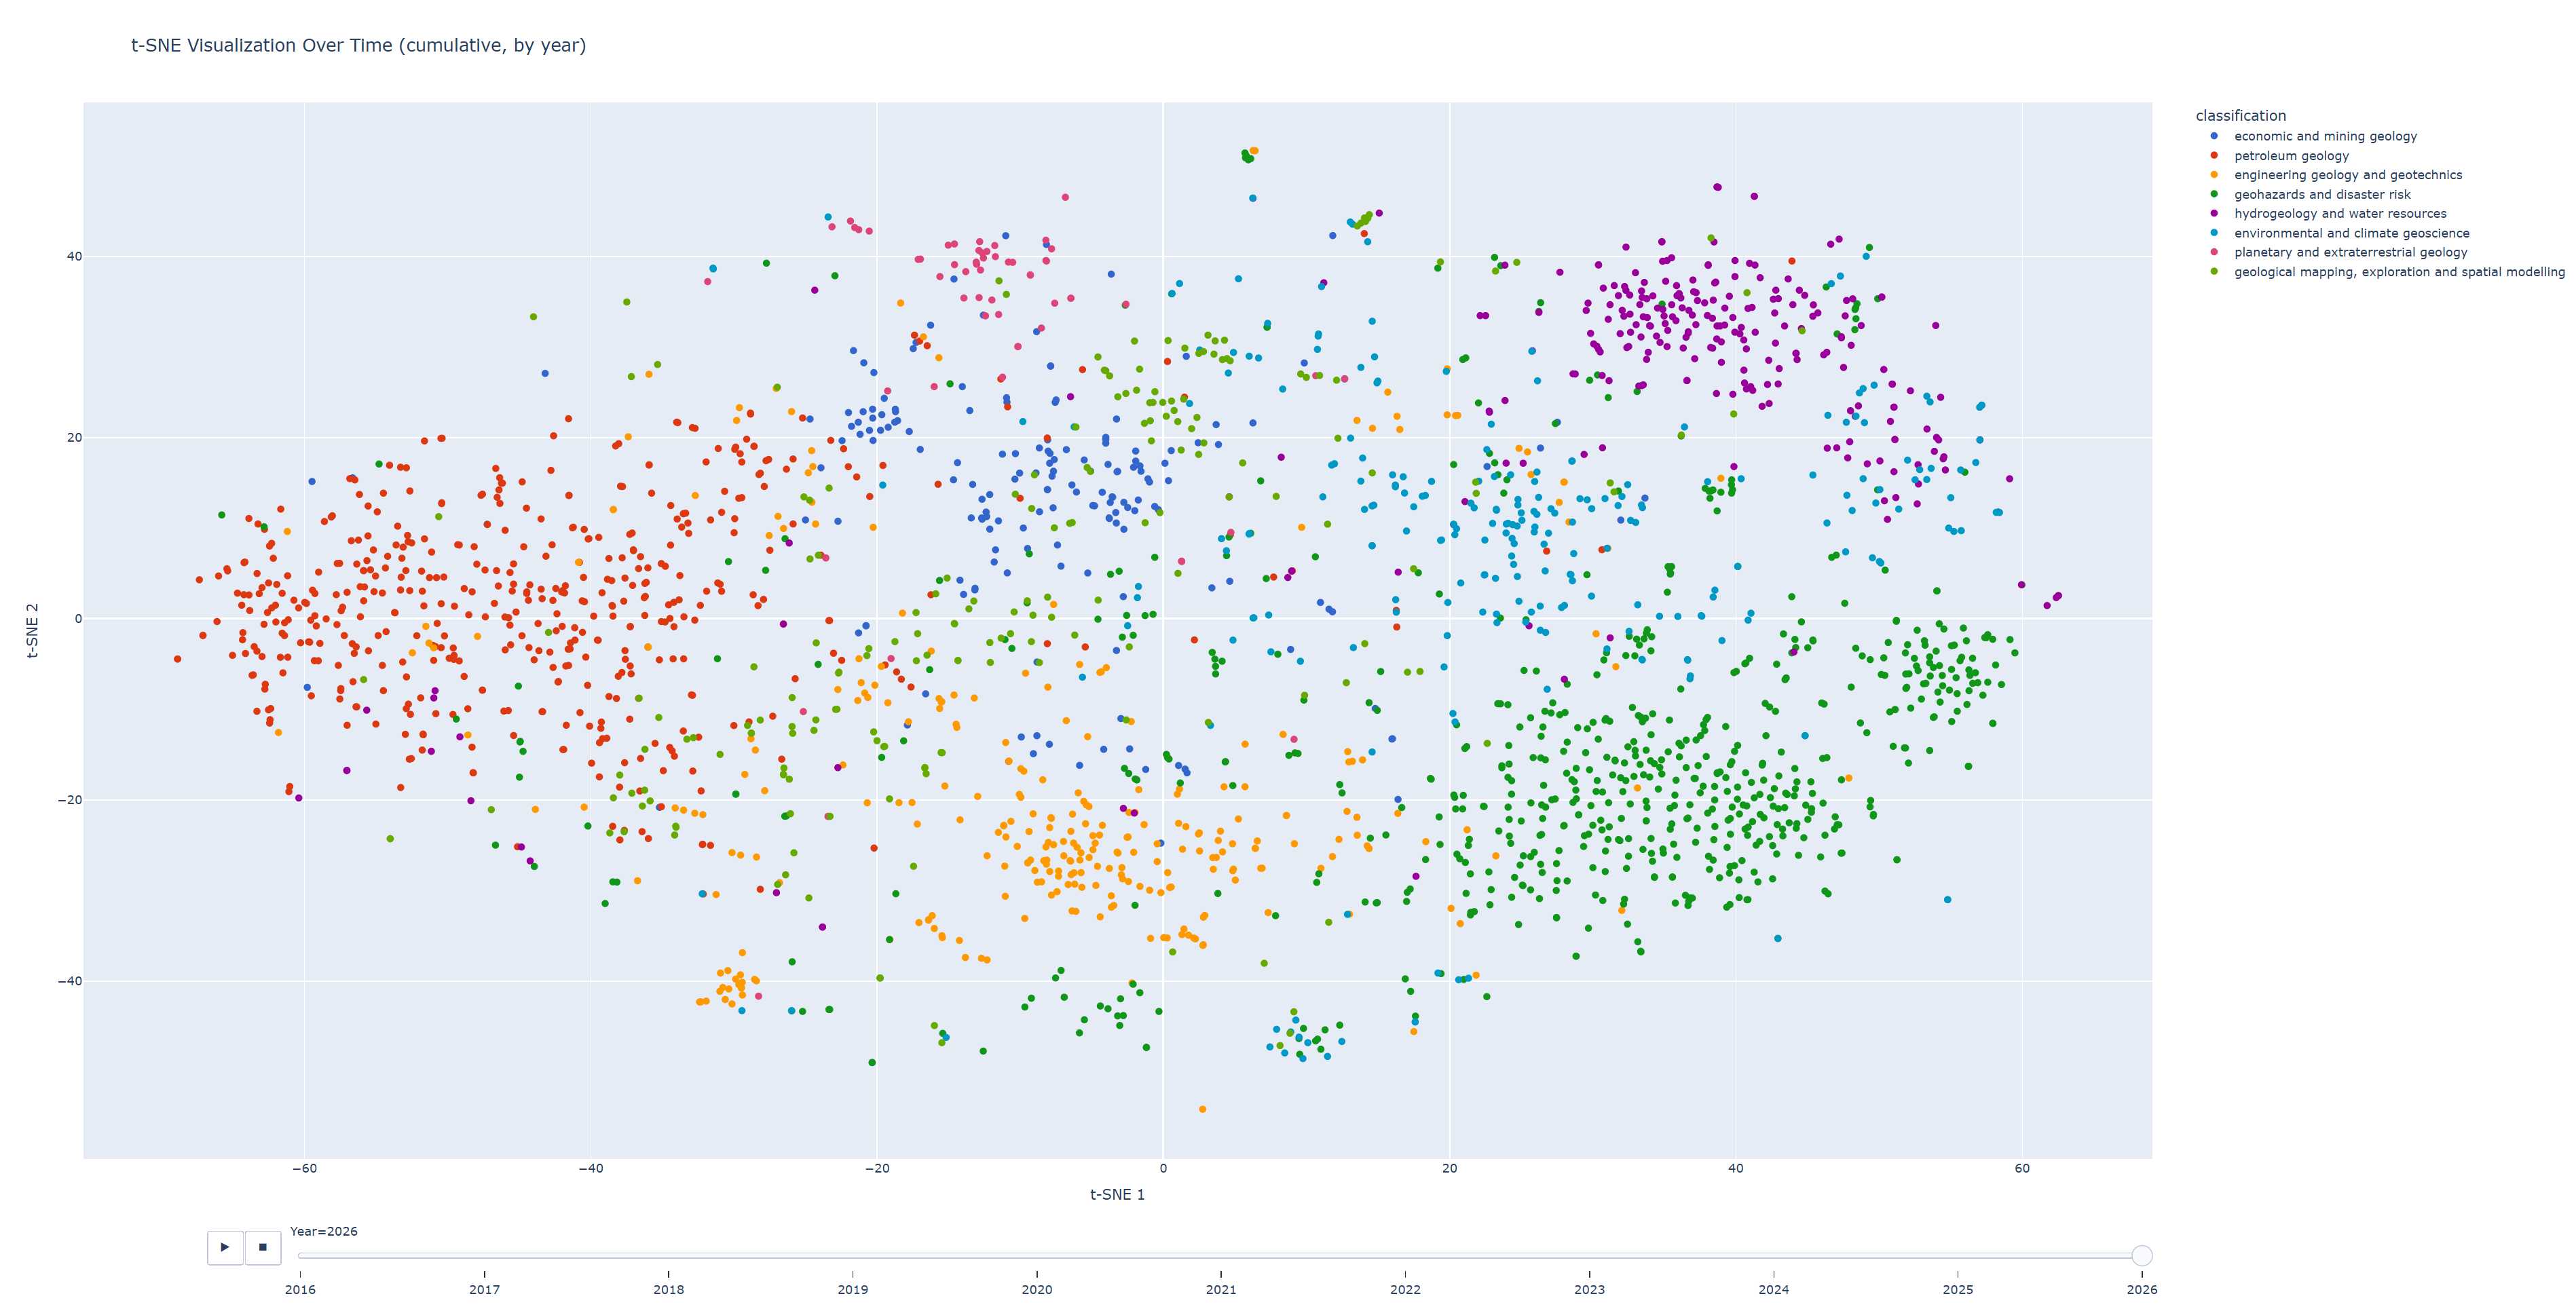
Global geology machine learning research (2016-2026) take #2 – animated text embeddings by publish date. Following on from my post yesterday I’ve created a t-SNE dimensionality reduction plot of cosine-similarity for embeddings of geology abstracts that mention machine learning over the past 10 years in published research articles. I used Dimensions database generating 2,882 papers.
This can help identify where classification is differentiating, dominated by a single category, and others which are less so. These are colour coded by the 10 classifications shown in the key.
Hydrogeology is a clear grouping – top right in purple, bottom right in dark green is the geohazards and disaster risk category. Just above in light blue is environmental and climate geoscience, the orange papers, predominantly bottom centre is geotechnical (engineering geology), far left in red is petroleum (oil and gas) geology. Top centre in pink/red is planetary geology (astrogeology). The olive green of geological mapping and spatial modelling is more diffuse.
More experimentation ongoing and link to spatial distribution. Take #3 coming up.
#geology#geosciences#earthsciences#machinelearning#artificialintelligence#visualisation#naturallanguageprocessing#languagemodels
 A Geodyssey - Geoscience Text Analytics and Enterprise Search Research
Leave a comment