
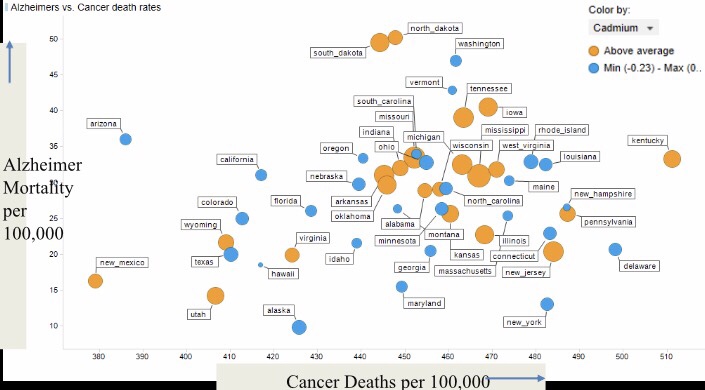
Geohealth: Text Analytics can be useful to test hypotheses and exploratory data analysis. I’ve taken the cosine similarity between word vectors of all US States and ‘Cadmium’ in 100 years of economic geology literature. Above the average shown in orange, below average in blue. This is combined with health data from national databases per US state. On the x-axis is cancer deaths, y-axis is Alzheimer’s. Obviously it’s a complex area, nothing statistically significant in this chart, but useful to experiment and further research areas of interest.
Text: Society of Economic Geology (via GeoscienceWorld)
Data: CDC , Alzheimer’s Association

Interesting research, Paul. Reminds me of this New York Times article about a town in Nevada and its asbestos problem: https://www.nytimes.com/2015/02/10/science/a-controversy-in-the-wind.html. I wonder if similar research could surface potential hazard areas by comparing mesothelioma cases and asbestos research.
LikeLike