
Finding trends and patterns in unstructured text can be possible without combining with other data sources. However, combining derived structured data from text analytics with measured real world data can also lead to differentiating insights.
Figure 1 shows the frequency of occurrence of chemical elements in the text of 100 years of the Society of Economic Geology (SEG) courtesy of GeoScienceWorld on the x-axis and abundance of that element naturally occurring in the crust from existing databases on the y-axis.
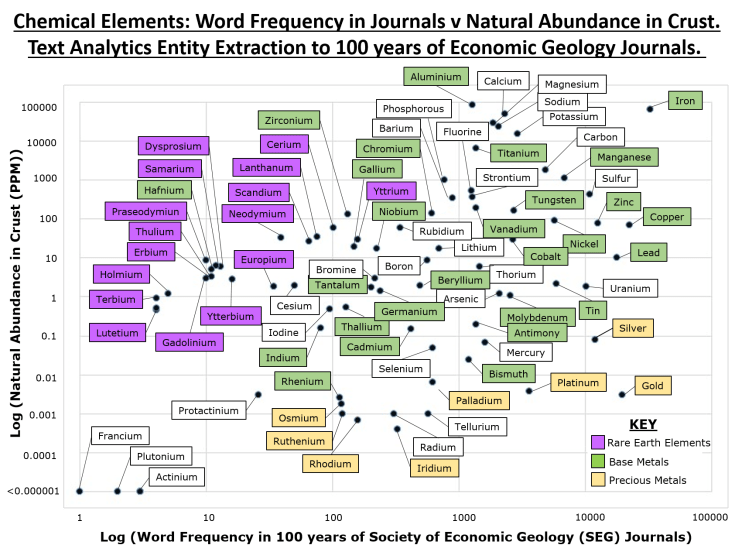 Fig 1 – Combining derives data from text analytics with measured data
The plot shows all data, but it could quite easily be animated through time to surface trends and hot topics. As an analogy, Professor Han Rosling has created some of the best displays I have seen on human population video here.
Journals depict social history; what scholars are writing about, the motivations, the drivers for this behaviour can be numerous and overlapping. Clearly new discoveries, economic forces, prices of commodities will be one, health issues (Geo-health) may be another.
From Figure 3, we can see Yttrium has the highest frequency in the articles of the Rare Earth Elements. Of the base metals, Hafnium appears of least interest to the literature, iron, copper and lead the most popular, with the precious metals of gold and sliver close behind. In terms of word frequency, there are many elements rarer than radium!
These are relatively trivial displays to produce, I make no claims or predictions based on them, I just find them interesting to visualize. Similar petroleum equivalents, may be to count the source rocks around the world by geological age in literature and compare to actual data showing producing fields and proven reserves. Maybe gaps can be surfaced for areas to exploit, driven by the potential described in vast amounts of literature that has yet to be realized.

Leave a comment