
One form of text summarization is by a timeline of some sort. In academic literature, this can help follow a discourse through time using bibliographic reference dates in the body of text.
In business literature, this may be more related to events and dates of some activity. In Petroleum Exploration for example, it may refer to the opening up of acreage, license rounds, seismic surveys, well drilling, dry holes or hydrocarbon discoveries, farm-in’s, field development, relinquishments and so forth.
It is relatively easy using Named Entity Recognition (NER) techniques to detect many patterns in text including People, Places and Locations Stanford GATE . Accepting that language understanding is hard so nothing is perfect (but then humans make mistakes as well..).
Dates are also straightforward, although the range of possibilities to express times and dates can be vast in certain contexts. Python has several libraries, there is also research from Facebook duckling .
A particularly useful web tool in my opinion that illustrates the potential of what can be done applying these techniques is TimeLineCurator by the University of British Columbia InfoVis Group.. A nice overview diagram of Visual Analytics is here.
For example, the image below (Figure 1) shows events automatically detected in text discussing the exploration history of the Norwegian Sea.
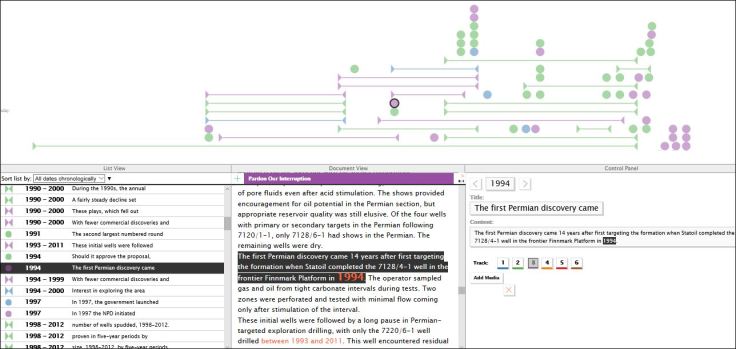
Figure 1 – Automatic Summary of Exploration History in a Basin
On the far left in the top half of the screen, exploration begins (1980’s), the black circle highlighted allows the user to interrogate key events (in this case the first Permian Discovery by Statoil in 1994), moving towards present day on the right. Sometimes dates are points (circles), in other cases ranges (lines). In this case the different colours are different information collections (e.g. NPD v Oil & Gas Journal). The panels in the bottom half of the screen show the text fragments/sentences on interrogation.
These interactive visuals may be particularly useful to interrogate a body of text that is simply too large (in this age of big data) for a human to read, given some time constraint.
Our cognitive processing limitations.
We know 95% of the time we never look beyond page 1 in Google. In these cases paraphrasing Nicholas Carr, instead of a scuba diver in a sea of words, we zip along the surface on a Jet Ski.
So these techniques may provide some use in surfacing events of interest, that we may have otherwise missed (or simply don’t know we missed). An area for a deeper dive.
Reference
Proceedings of IEEE Conference on Visual Analytics Science and Technology (VAST), Chicago, USA, 2015.

Leave a comment