

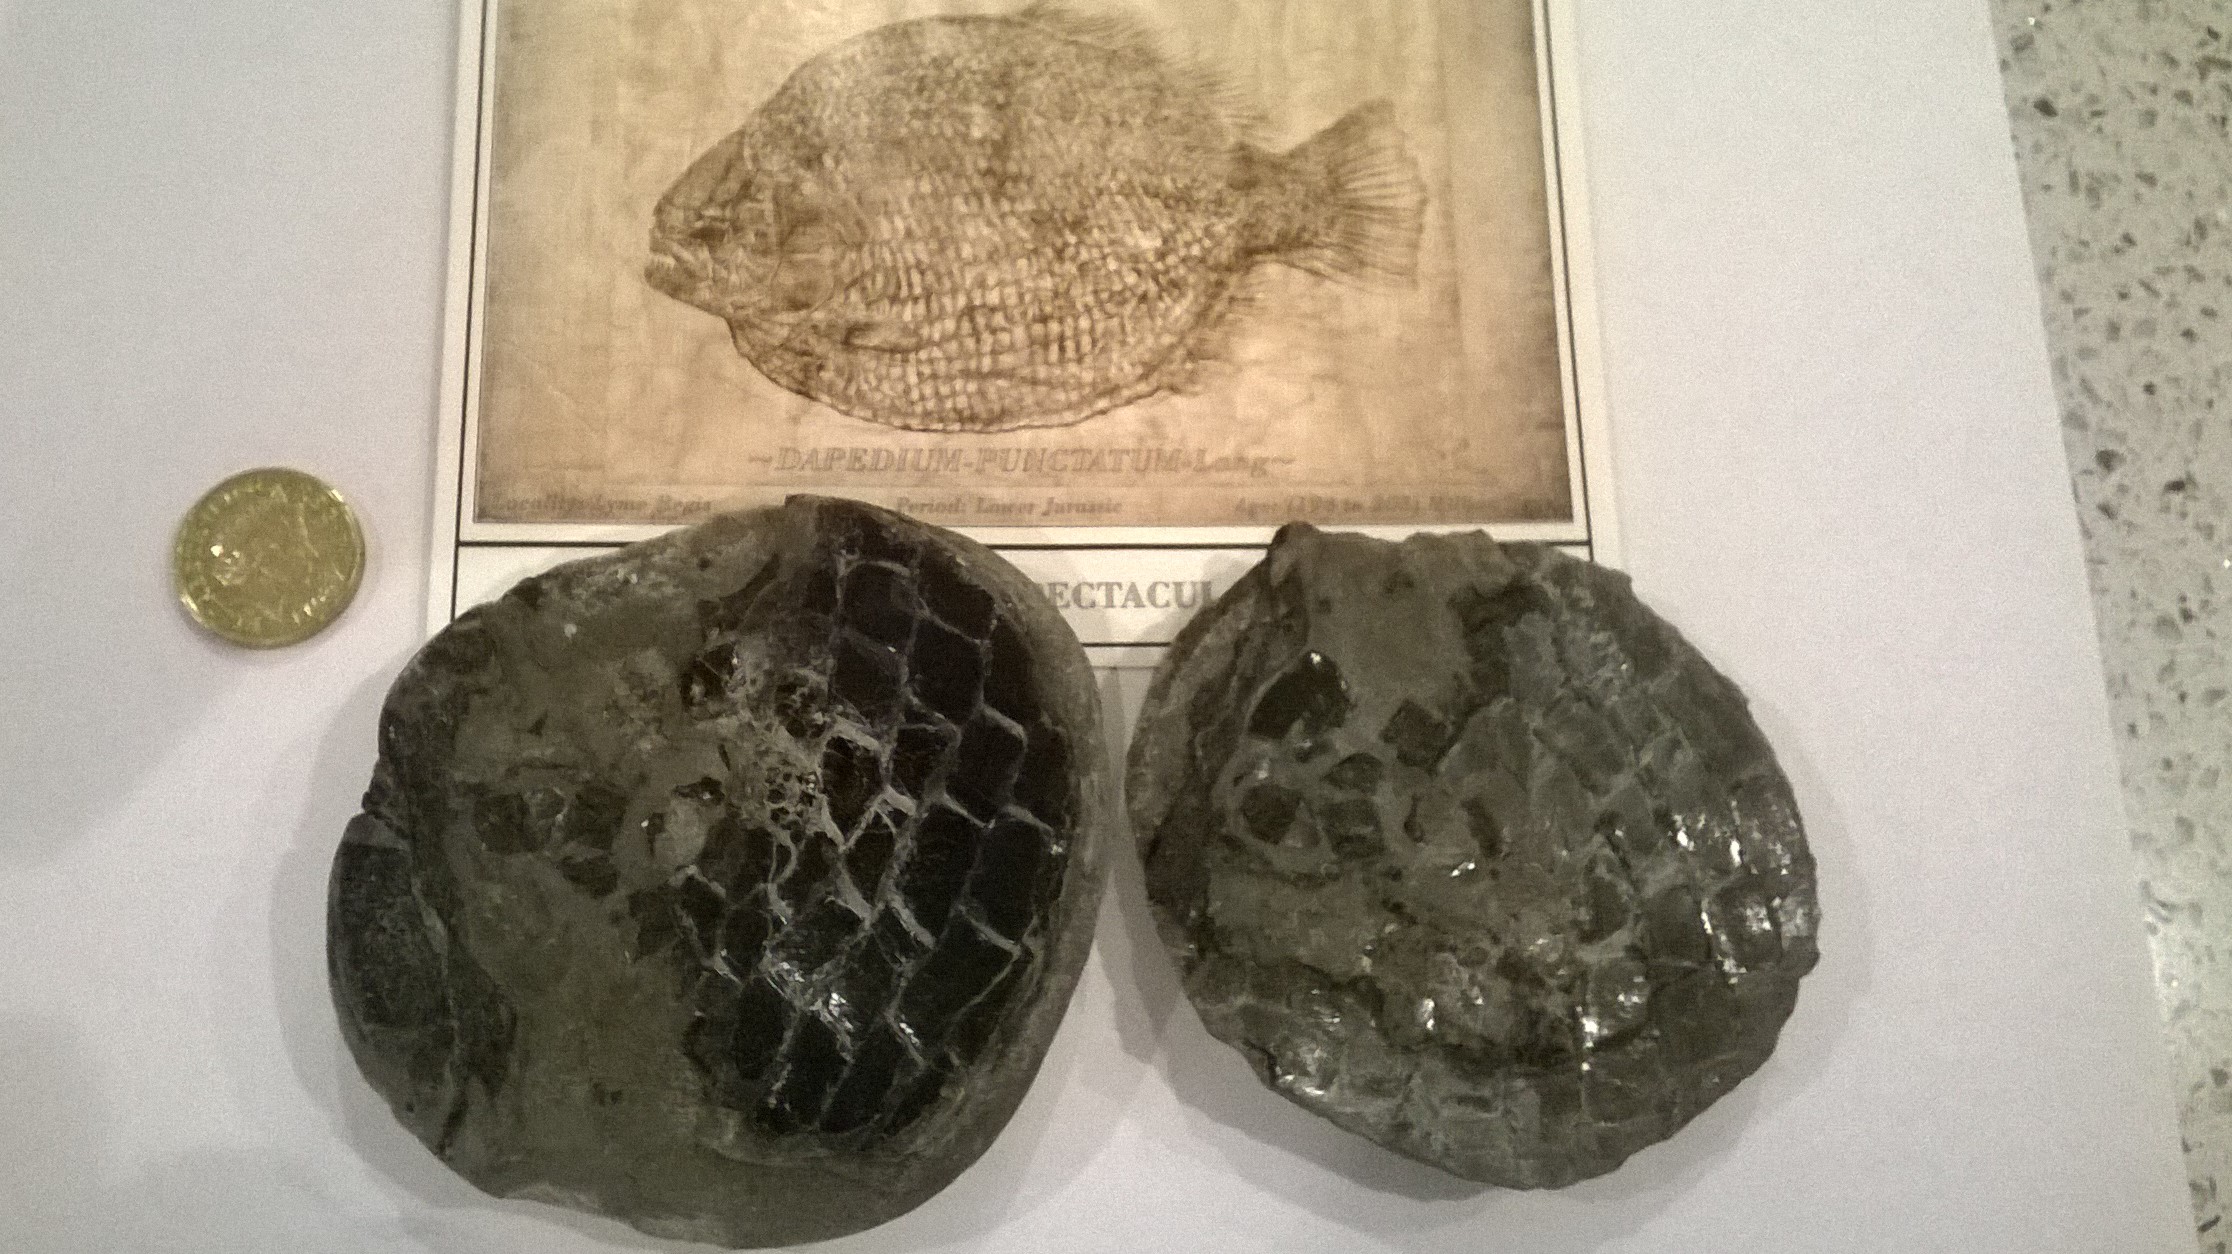
Before I delve into this topic, I’ll start with a story that led me here. This year I went on a fossil hunting expedition with my family to the Dorset coast in the UK. We spent several hours scanning the beach performing our usual ‘pattern recognition’ to look for ‘flying saucer’ shaped pebbles of a certain colour. I was lucky enough to find a nodule containing a Jurassic Marine Fish (Dapedium). The nodule is shown below, on the left you can see the back of the skull and the thick scales, next to a coin for scale and an artists impression of the fish.
So what has this to do with Deep Learning?
Well, I tested some photographs I had taken on the beach with the Google and Microsoft Image API’s available on the web (there are others as well of course, such as OpenSource TensorFlow libraries that can be used in Python). I took a screen ‘snip’ of the photographs and saved a JPEG to ensure the image had no locational metadata. When I ‘drag and dropped’ the image into these API’s, I was stunned to find that one of them had geo-located (positioned on a map) the photograph on the very beach where I had stood and taken the photo! Others may not think this ‘landmark’ detection anything special, but I still marvel at this. This started me thinking what else could we do with image classification in the Geosciences. There has been significant and ongoing research using deep learning on high resolution images in the geosciences (using powerful microscope images of microfossils, SEM, seismic and remote sensing data). But what about the relatively poor quality material (in terms of resolution) typically added to the average document, article and report?
Geoscience literature and reports contain numerous images (such as charts, maps, sections, plots etc.). Whilst general OpenSource Optical Character Recognition (OCR) will extract explicit text on any image, there are other opportunities to extract implicit information about (and from) these image objects.
Classifying the ‘type’ of image is probably at the lower value end, but may be useful. Especially as some images may not be associated with text or captions/figure labelling.
I will be conducting some user Human Computer Interaction (HCI) studies in academia with Geoscientists from different industries and roles to ascertain what is most important and why.
Classes
By looking through a representative sample of public domain Petroleum Systems reports, seven high level common classes of geological image types were identified: Seismic sections, Maps, Photographs, Cross Plots, Stratigraphic Charts, Logs and Cross Sections.
A Deep Learning Convolutional Neural Network (CNN) with transfer learning, was applied to balanced training sets of approximately 200 public domain images per class. Of these, approximately 80% was used for training and 20% for testing. Transfer Learning ‘piggy backs’ off pre-built models that have used hundreds of thousands of images, by using those existing ‘generic’ layers and supplementing them with ‘domain specific’ ones. This is useful as for many subject domain classes and features, it is likely that only a small number of training images is easily available.
Part of the pre-trained models used include weights from the VGG16 Model which is a deep (16 layer) convolutional net trained on 1.3 million images for 1,000 general image classes, that generalises well to other datasets. There are models ResNet that are much deeper (can be hundreds of layers) and the ImageNet research initiative contains over 14 million images linked to WordNet.
Results
Testing on the geoscience images and classes gave a projected accuracy of 92.7%. This is the likelihood that an image that belongs to one of the seven classes, will be classified to the correct class using examples (the 20%) not used during training (machine learning). Cut-offs or other techniques can be used to ignore images not related to the pre-defined classes if they are encountered.

You can try the resulting classifier yourself, using Google Chrome < Click Here > using the Vize.ai API. Simply drag and drop a sample image and it will return the classification. For the example below, the classifier is 99.9% certain it is a seismic section. Correct!

Sub-Classes
Moving down one level from these classes to sub-classes, I experimented with some Map Types. The training data available for this short experiment was a little sparse, more uneven and differences between the classes more subtle. This led to an overall accuracy of 76.9%.
This could probably be improved with further iterations, merging some classes and adding more training data. Reviewing the results (see image below), ‘Paleogeographical Maps’, ‘Tectonic Element Maps’ and ‘Seismic Basemaps’ had high accuracy. The subtle differences between other types of maps leading to poorer results based on the limitations described above in this experiment. This presents an area for further research.

Features/Objects
In addition to information on what an image is, it is also possible to train a classifier to detect what the image contains. This could range from geological photographs showing depositional, diagenetic and structural (e.g. faults or folds) features; seismic sections showing extensional or compressional features, through to geological cross sections showing roll over anticlines and Lithostratigraphy charts showing symbols for petroleum system elements such as source rock.
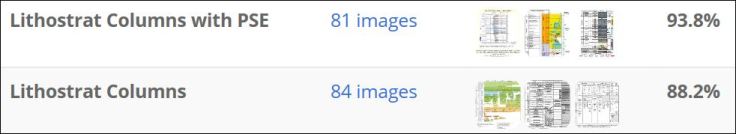
The example below shows the latter, with an estimated 90% accuracy. Petroleum Systems Elements (PSE) typically cover source rock, reservoir, migration, seal and trap. Whilst there are sometimes columns on lithostratigraphic charts labelled with text in a variety of ways (e.g. Source Rock, source, SR, Sr. Charge), they are not always present; sometimes a legend is used at the base and sometimes labelling is absent completely. Detecting the presence of these symbols (sometimes black or coloured circles, ticks, diamonds etc.) without relying on OCR and where the symbols occur on the image, could be useful.
By providing examples of each, deep learning can detect patterns enabling classifiers to detect such nuances. These features may not be described using text, so these techniques may surface information that traditional ‘enterprise search’ approaches miss every time…….you may even catch a “big fish” 🙂
