
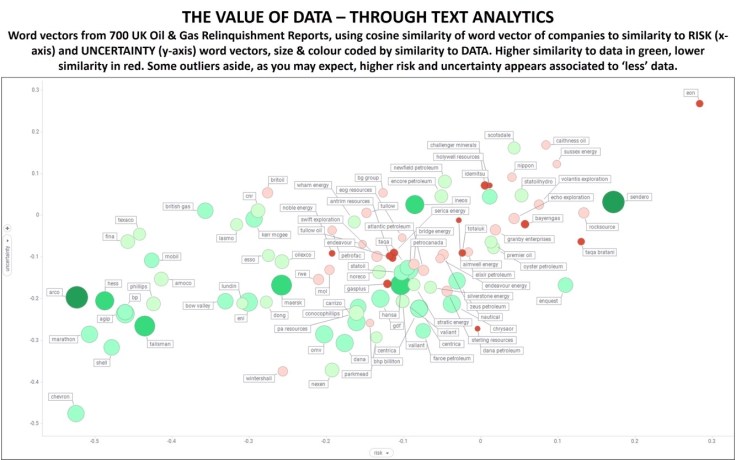
I created a vectorspace model using 700 UK license relinquishment reports, comparing companies to risk (x-axis) and uncertainty (y-axis) using word vectors and cosine similarity. Based on patterns in text, those companies in the top right quadrant have a higher ‘similarity’ to risk and uncertainty; those in the bottom left – the opposite. The companies are sized and coloured by similarity to the word vector of ‘data’. As you might expect (certain interesting outliers aside) the companies with closer similarity to ‘data’ (green – larger) are less associated to risk and uncertainty. Whereas those companies with low similarity to ‘data’ (red – smaller) have tendencies to have higher similarity to risk and uncertainty. I have not normalised company names so you can see historical trends over time such as ‘British Gas’ and ‘BG’.

Leave a comment