
I was delighted to be invited to the Esri Petroleum User Group (PUG) this week. Over 180 people gathered near St Paul’s in London for the latest on Geographical Information Systems (GIS) in the Petroleum Industry.
I’ve always had a passion for this area since I wrote a GIS system in Turbo C as part of my MSc in ‘Computing in Earth Sciences’ back in 1990. So people could click on a well from a map and bring up automated lithology interpretation based on wireline log data.
Despite this, I had never been to a PUG before. It was superbly organized by Thierry Gregorius and the organizing committee along with ESRI, with a rich and diverse set of presentations and workshops. From Digitization and analytics, oil spill contingency planning to pipeline and oil and gas exploration workflows. Too much for me to give justice to all, so here is a summary in the areas of my interests.
Finding information
Nick Fosbery of Loxodome presented ‘insight through integration’, how Graph Databases can be used with GIS systems. He stated that the next wave of competitive advantage will be using connections to identify and build knowledge. Demonstrations were given with Neo4j as a data discovery layer and how lists and document libraries in SharePoint could be geo-enabled in an ArcGIS map, as geoscientists wish to access documents from a map not long text lists, as shown in the photo below.

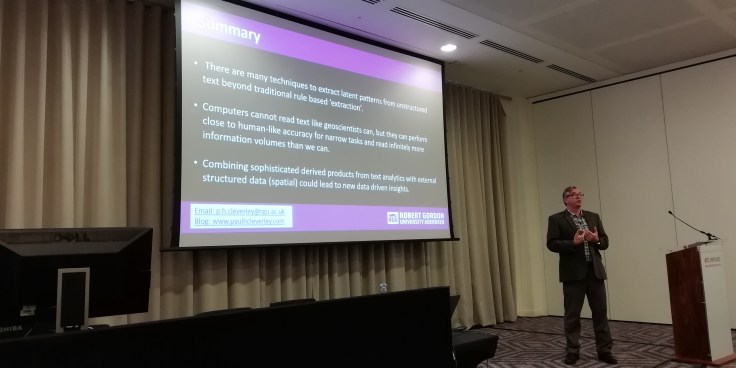
I then gave a presentation on text analytics and machine learning in geoscience, most of the content pulled from this blog. Surprisingly, I received more questions after the talk than probably at any other conference presentation I had given previously in the past 2 years. The questions and discussions followed after the break over coffee and perhaps one of the most satisfying things was someone saying to me at the coffee machine immediately afterwards, “I have never understood what Artificial Intelligence (AI) actually was, until your presentation”. This is hugely satisfying, and makes the effort of giving conference presentations so worthwhile as an education exercise.
Exploration Oriented Workflows
DNO Norge gave a presentation on exploration workflows followed by Wood Mackenzie by their team in Moscow. They discussed the issues of stratigraphic naming when classifying stratigraphy, such as the formation Usolskaya being called the Nelbinskaya, Yureginskaya and Billirskaya in different parts of a Russian Geological Basin. After these data wrangling issues they showed the value in building a 3D structural model of a basin to assess the impact of structural setting on hydrocarbon accumulations.
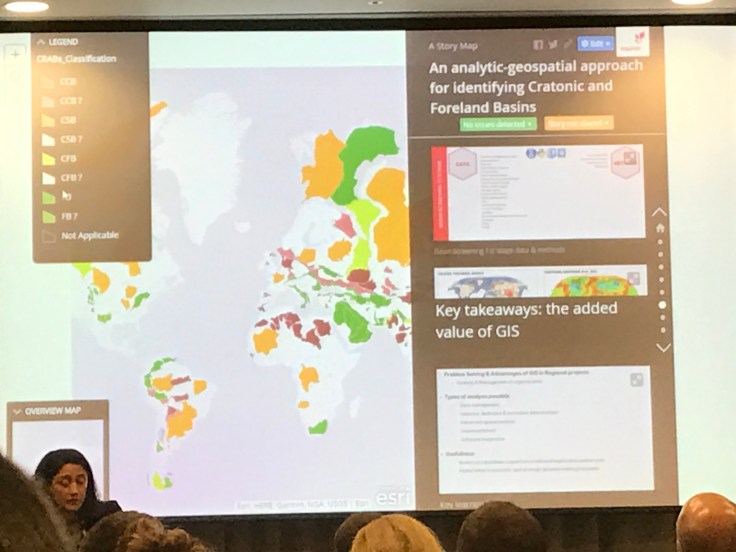
One of the most interesting talks was from Sofia Campo at Equinor. Sofia presented Equinor’s meta-study on onshore basin classification (whether a basin was a foreland basin or a cratonic basin) through an analytic geospatial approach. The idea of the meta-study was to gain knowledge and new ideas on onshore basins which is a key part of Equinor’s strategy.
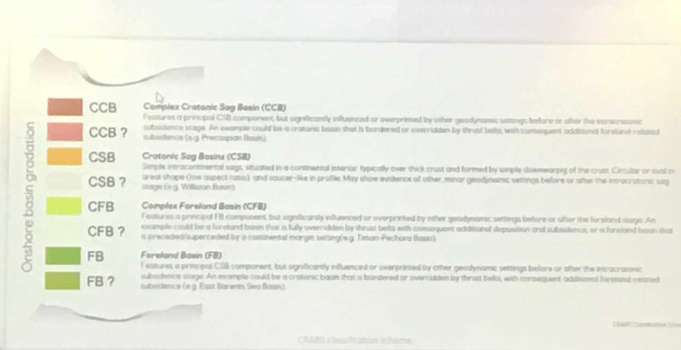
Basin classifications from GETECH, TELLUS and I.H.S. are similar but have differences/contradictions. Equinor approached the issue in 3 stages:
- Classification through workshops using existing human knowledge. What we think we know or believe.
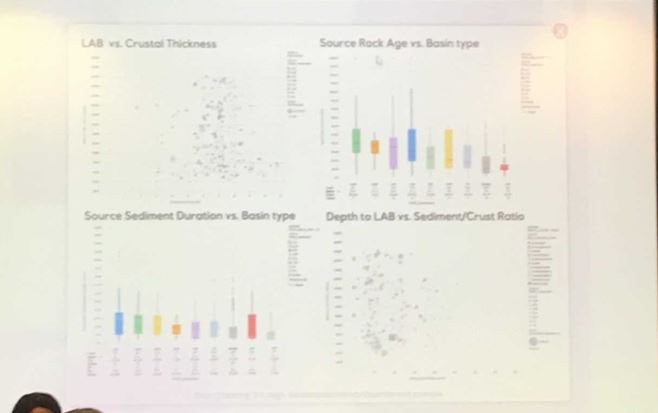
- Inductive Data driven classifications, with data clean-up (using R, Python, Spotfire, ArcGIS) used data from in-house (e.g. sediment thickness map) and external literature. Used exploratory statistics, histograms, zonal geometry, densities and ratio’s. Output was an aggregated feature class in ArcGIS. Data used included:
- Subsurface regional studies, interpretations and reports
- Basin Monitor Reports
- Cultural Data
- Basin Outlines and Age
- Source Rock Polygon and Age
- TOC
- Plate Location Types
- Kerogen Types
- Laboratory data
- Basin Classifications
- Sediment Thickness
- Crustal Thickness
- Heatflow
- Discovered Generated Resources
- Acreage
- Wells and Fields
3. Generate new ideas – data challenges “firm convictions”. Not all data was considered trustworthy, but in some cases data did legitimately challenge preconceived beliefs..
Areas to improve for the method, included using more documents as they were not labelled correctly on G drive not always easy to locate and use. Some of the results are shown below:
GIS and Digitization
The final session included presentations on the role of GIS in Digitization. Jostein Bjerkan from AkerBP discussed how “we have been doing digitization for years” and how they were building a data lake with Cognite via ETL processes. They have built many custom ‘reports’ to allow geoscientists to quickly access the geological data they need from a map, critically, in a form they can exploit quickly (e.g. using cross plots).

An impressive slick video was shown of their prototype using a Gaming App to visualize all their data in 3 dimensions enabled by their data lake. It is not operational but the focus was to show what may be possible. It was impressive in my view.
Mark Jones from Shell highlighted the point that what a geo-information analyst does is very similar to a data scientist. They should not be seen as separate. Geospatial is a key aspect in analytics but is not always considered. This fits in a wider ‘digital strategy’ for Shell.

The relatively new ‘Insights’ feature from ESRI ArcGIS was discussed after trials from Shell. It offers potential to democratize geospatial analytics by allowing geoscientists to quickly create their own queries and reports. There was much debate on where this fits with tools such as Microsoft PowerBI or Spotfire. Spatial integration was obviously a key part but the Unique Selling Point (USP) for some for some of these features is still unclear.
Summary
The convergence of visualization, spatial, unstructured documents and structured data continues to gather pace.
Many geo-information analysts feel the new wave of digitization and analytics is high on buzzwords and they have been doing many of these methods for years.
There was probably not as many case studies or methodological presentations around advanced ‘predictive’ analytics with a spatial component (Equinor’s Basin Classification presentation excluded) as I would have thought. Studies still appeared dominated by ‘classic’ GIS portal stories, accepting confidentiality may play a role in what is presented at conferences. Nonetheless, more opportunities to blend predictive analytics from structured data, unstructured information and spatial together in one approach, may present some new opportunities for differentiating insights.

Leave a comment