
It can be quite addictive to experiment plotting word vectors of various geological entities and classifications.
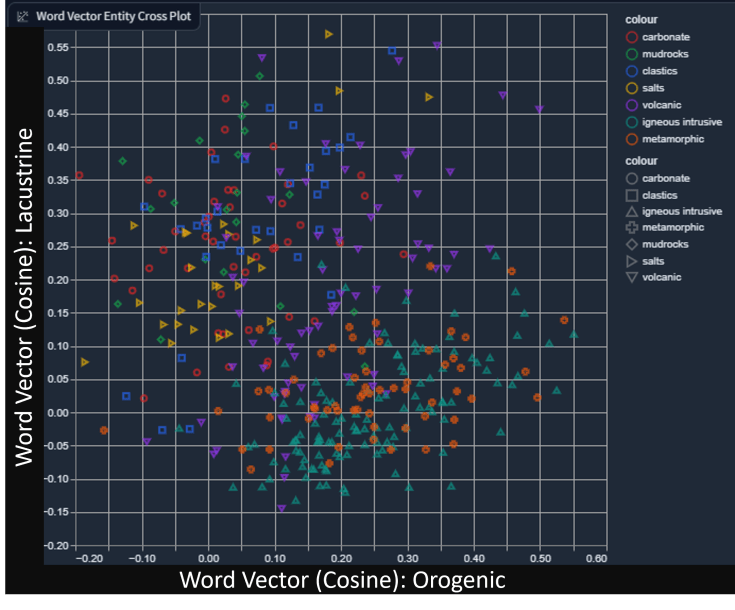
Here I have chosen lithology (thousands of terms grouped into higher lithological classifications shown by the colours and symbols) using the word vector ‘orogenic’ on the x-axis and ‘lacustrine’ on the y-axis.
The lithologies further to the right are more ‘associated’ to orogenic and those further to the top are more ‘associated’ to lacustrine.
1. Metamorphic (red crosses) and igneous intrusives (green triangles) are largely clustered bottom right as you’d expect with mountain building events.
2. In the top to mid left we have mudrocks (light green diamonds), carbonates (red circles) as you would expect and clastics (blue squares) with some significant outliers. Salts (yellow triangles pointing right) plot middle left generally not associated with mountain building.
3. Volcanics (inverted purple triangles) split groups (1) and (2) with quite a bit of scatter.

Leave a comment