
Space and Time are the two key contexts for the Geoscientist. My previous post showed a query result on a map (spatial) using word vector similarity.
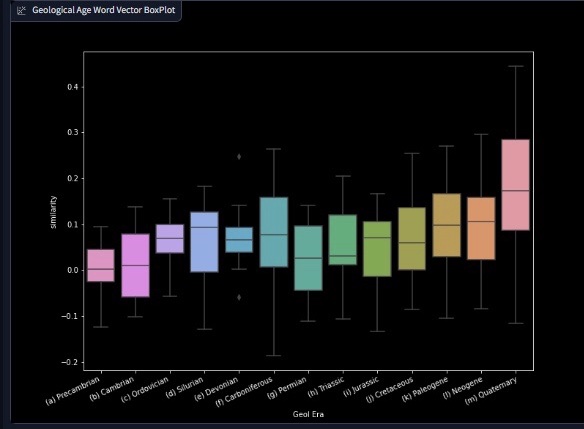
This box-plot shows time; the x-axis is geological age, old to young, left to right – (Precambrian on left, Quaternary on right).
The y-axis is cosine similarity, to the vector of every subdivision name encountered in millions of words of geological articles per geological era/period.
These interactive plots can stimulate learning events and spark new lines of thought where patterns differ from the orthodoxy ‘common knowledge’. Abductive geoscience discovery!
I have to acknowledge being conceptually inspired at the ‘bigger picture’ in Geosciences a few years ago by a paper from Karpatne et al (2017) Machine Learning for the Geosciences: Challenges and Opportunities.

Leave a comment